
Real rides, not samples
Every recorded ride enters the analysis anonymised – all year round, not just on counting day.
Bike Citizens Analytics
The anonymised rides of the Bike Citizens app become the foundation for bicycle traffic planning: exact routes, speeds, delays and route choice – on a map, all year round.
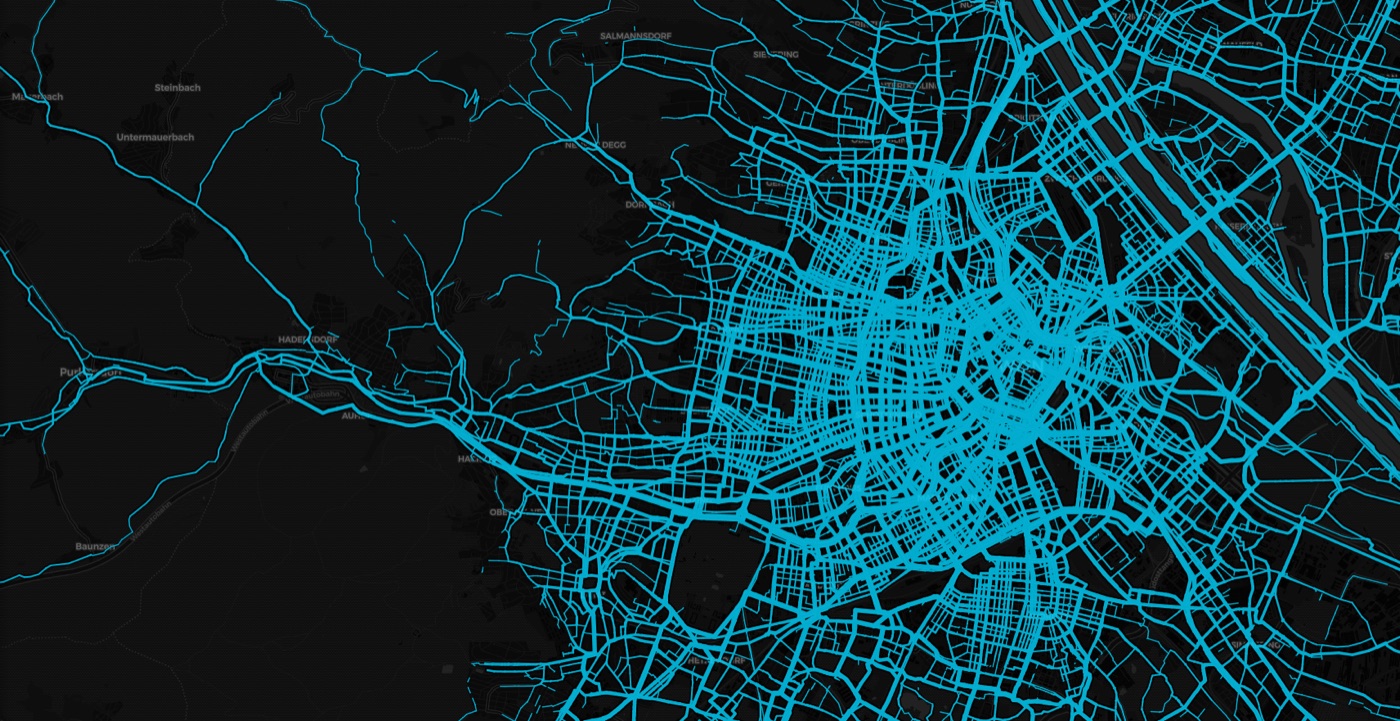
Of all survey methods, GPS cycling data renders the most information: the exact route taken, speed, delays and even route choice. That makes it the strongest foundation for infrastructure planning and policy.
Every recorded ride enters the analysis anonymised – all year round, not just on counting day.
The features focus on bicycle traffic and its framework conditions: the whole traffic infrastructure and its impact on cycling.
Real cycling data is visualised on maps. Every analysis is readable at a glance – in conversations with politics, administration and the public.
Zoom into a fascinating new world: each feature answers a question of bicycle traffic planning.
Intensity
The heatmap shows how many cyclists use each stretch of road – the brighter, the more. Intensity, speed and direction over time are available on segment level.
Traffic Spider
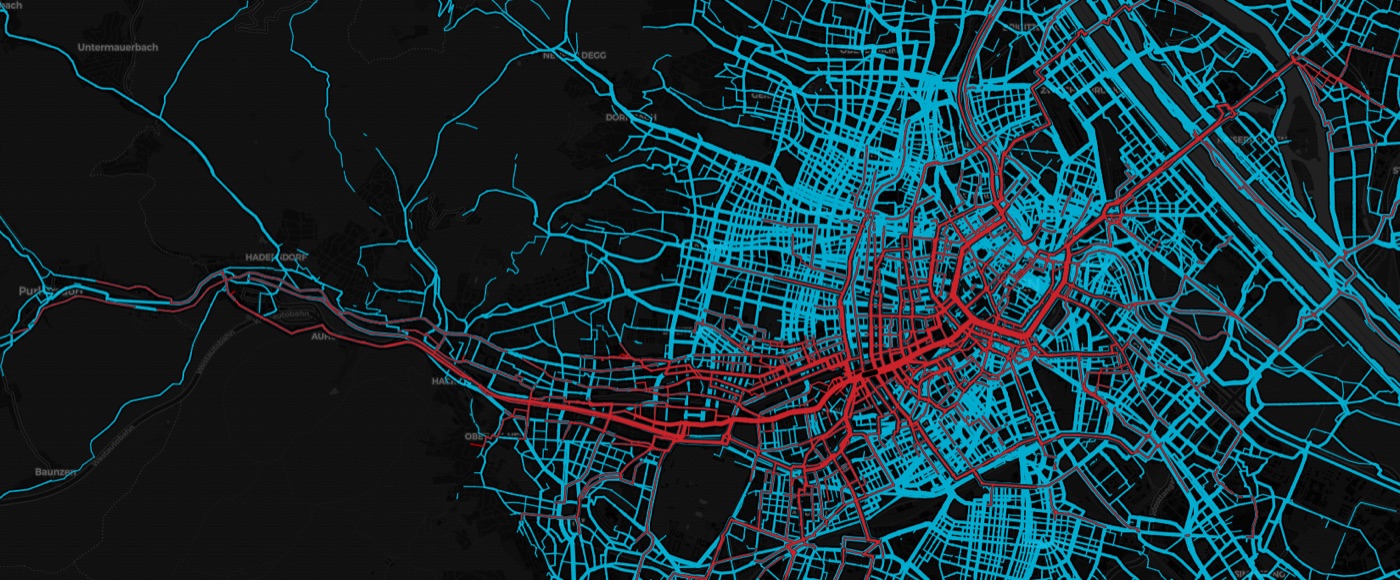
Origin–destination analysis for streets, areas or single sections: the Spider reveals the role a segment plays within the whole network.
Action radius
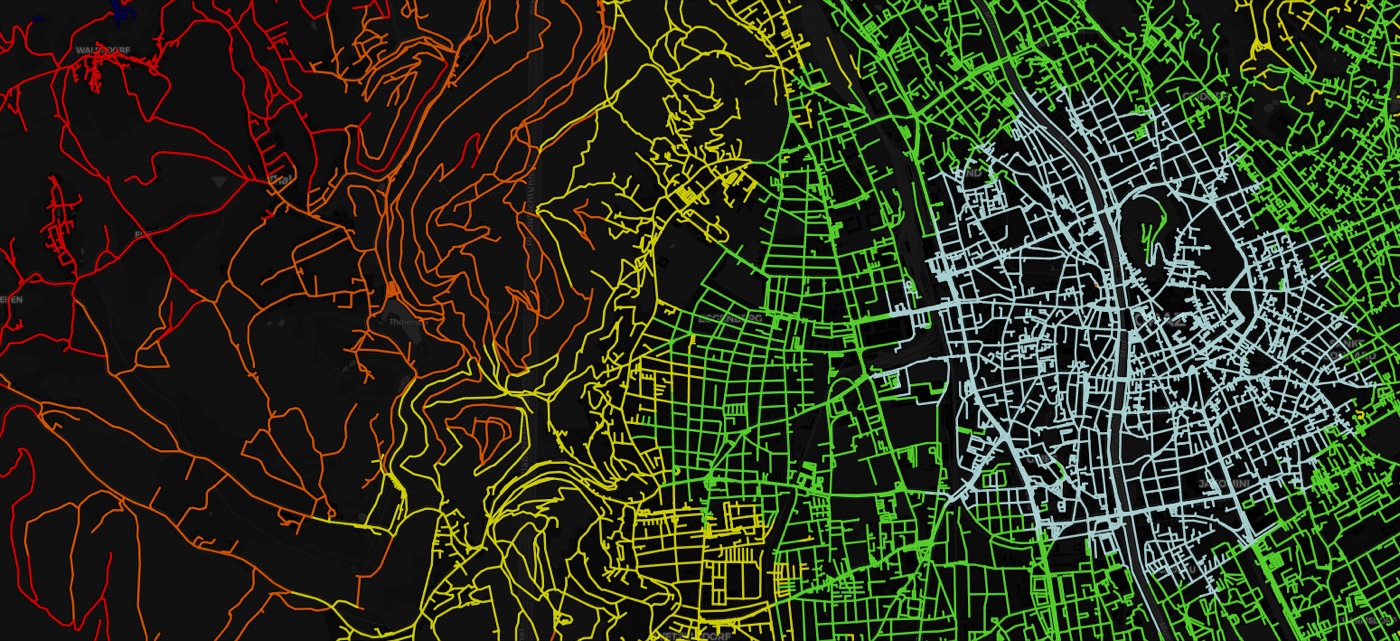
How far can you go by bike within 5, 10, 15 or 20 minutes? Measured speeds instead of assumptions – completed with OpenStreetMap where no rides were recorded yet.
PING if you care!
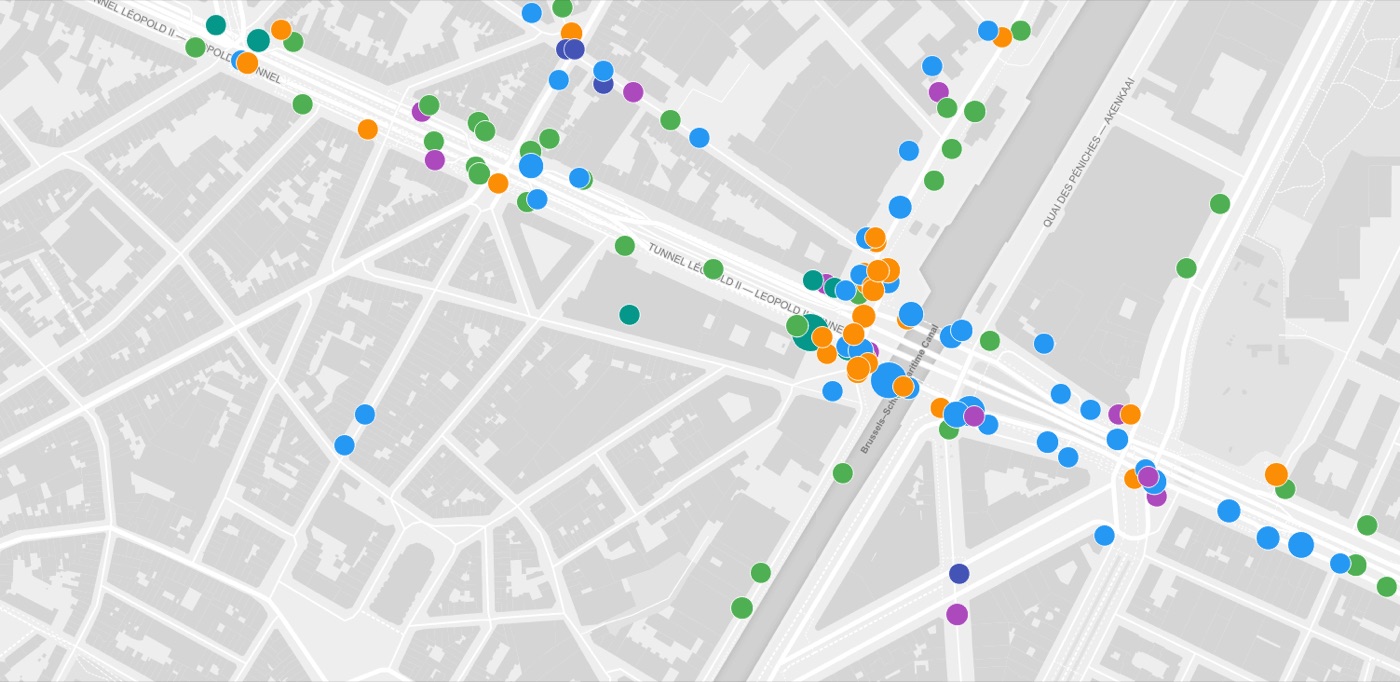
At the push of a button cyclists report where things go wrong. The reports form a subjective layer on top of the measured data – and show how cycling feels in your city.
Bike Citizens Analytics keeps growing. Some features are self-explanatory, some work invisibly in the background, some reveal their true power in combination – for instance on the split screen. For marked features a click on a road segment opens the detail screen with numbers and a graph.

Heatmap by the number of cyclists on the road network: the more rides, the brighter the route. Intensity, speed and direction over time on segment level.

A click on a segment shows the number and direction of rides, speeds by day or weekday and the lengths of the rides running through the segment.

A notional intensity map: for every real ride the shortest route between start and destination is simulated according to the route planner – the comparison shows where the network forces detours.

Average speed on single road segments.

Speed on a segment compared to the average speed of the entire ride, in percent.

Where rides drop to 0 km/h: the more often cyclists stop at a location, the larger the dot; colour indicates waiting time. Crossings and traffic lights with long waits stand out immediately.

Preferred and avoided routes: where cyclists rather take a detour and where they avoid the shortest route. Avoided shortest routes appear red, popular detours green, line thickness shows intensity.

Highlights all segments belonging to rides that run through a selected segment and so reveals its role in the road network. Ctrl+click shows additional information.

All rides between two freely drawn lines – from a single crossing to the relationship between two city districts.

Highlights the segments of all rides ending in a freely drawn polygon – for shopping streets, districts, crossings or venues.

How far can you go in 5, 10, 15 or 20 minutes? Actual ride speeds, completed with OpenStreetMap data where no rides were recorded yet.

Shows the reports of the PING Bluetooth buttons: cyclists mark locations and comment on them. Correlated with the ride data, this shows how cycling feels in a city.
About the PING campaign
Live data from existing permanent counting stations: loops in the ground deliver exact numbers at one point – without knowing individual cyclists or routes. The complement to calibration.

App rides correlate with existing counting stations at 0.82. Once calibrated, the GPS data can be extrapolated to overall road use – every map shown as recorded or as extrapolated.
Every analysis on the background that suits the presentation – from black and white to colour.
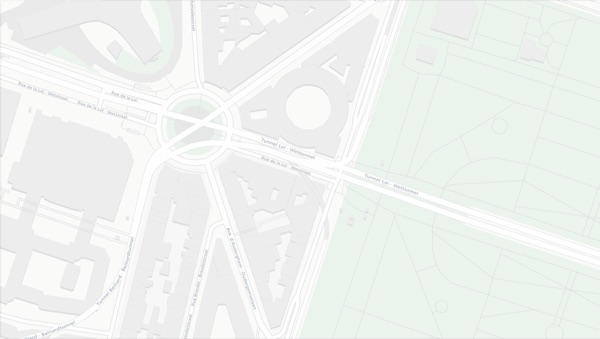
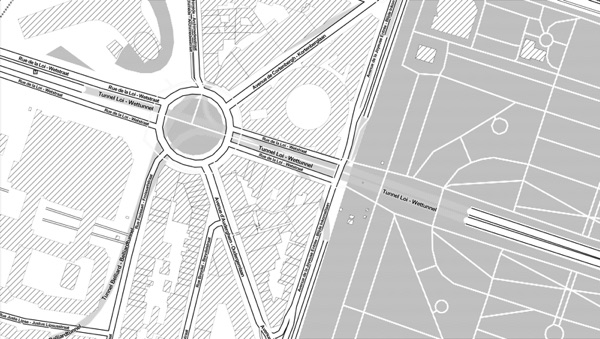

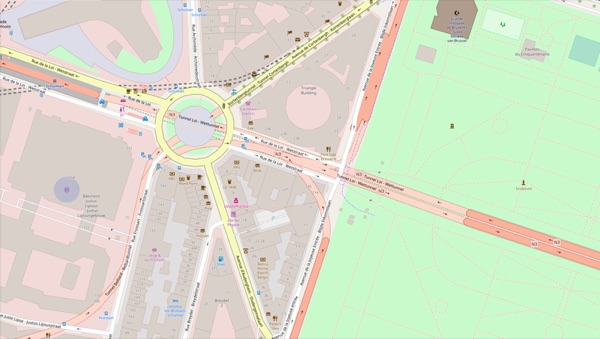
Also available: CartoDB Dark and Stamen Terrain.
Cycling data does not generate itself. The bicycle works just fine without an app – there is no reason to record everyday rides. Cyclists do it when an app truly makes cycling better: through value, through fun and rewards, or by taking part in shaping their city.

Navigation on bicycle-friendly routes, first-hand news, a community: those who benefit record their rides – for their own good.
The Bike Citizens app
Challenges motivate people to get on their bikes and track their rides. Collecting badges is fun – even more so when the game arrives in real life: the Bike Benefit system rewards cycling and supports local shops.
The campaigns
Crowdsourcing campaigns like PING if you care! create participation: at the push of a button app users drop a GPS tag and describe within seconds what they notice. Little effort, big results.
About the PING campaignBike Citizens Analytics was developed in 2017 together with NHTV Breda and is continuously extended – the first version was called Bike Print, the current one Cycle Print. Behind it stands Bike Citizens: founded in 2011 by two former bike couriers with the aim of making urban cycling more attractive and so improving the quality of life in cities.
Traffic and urban planners all over Europe have already tried the demo version. We will get back to you.
Or directly by e-mail:
info@bikecitizens.net